Session 01
Why Probability Matters
Overview
Before diving into formulas, let's see why probability matters. These cards illustrate common traps in reasoning about uncertainty—and how probability helps you escape them.
1. Probability is the language of uncertainty
How you get fooled
Someone says "it's extremely reliable," and you feel reassured—because nobody put a number on "extremely."
The trap in action
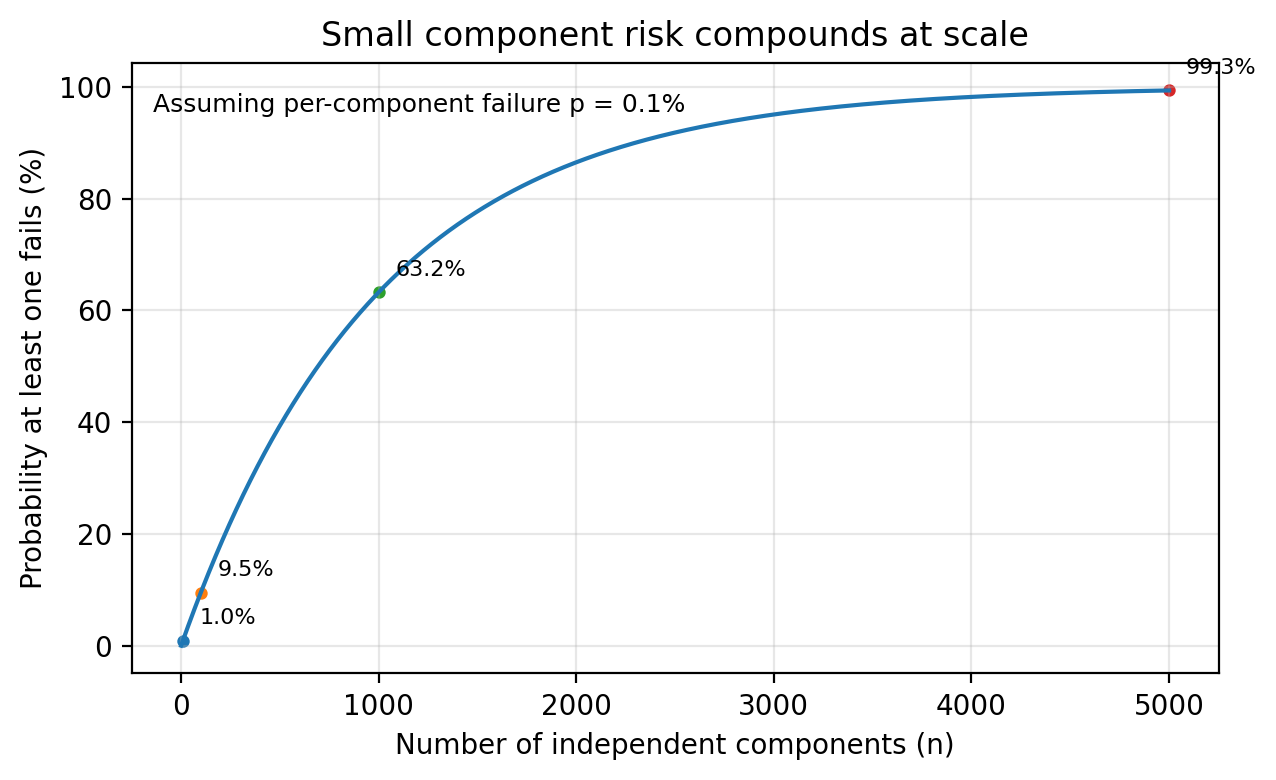
In complex systems, "rare" events stop being rare. If a component has a 0.1% failure chance, that sounds safe—until you have thousands of components and ask: what's the chance at least one fails?
The insight
Probability forces you to replace "pretty sure" with a number. And once you have numbers, risks compound, combine, and scale in ways that language hides.
2. Evidence is conditional
How you get fooled
You notice a pattern and treat it as universal, forgetting that your evidence came from a specific situation.
The trap in action
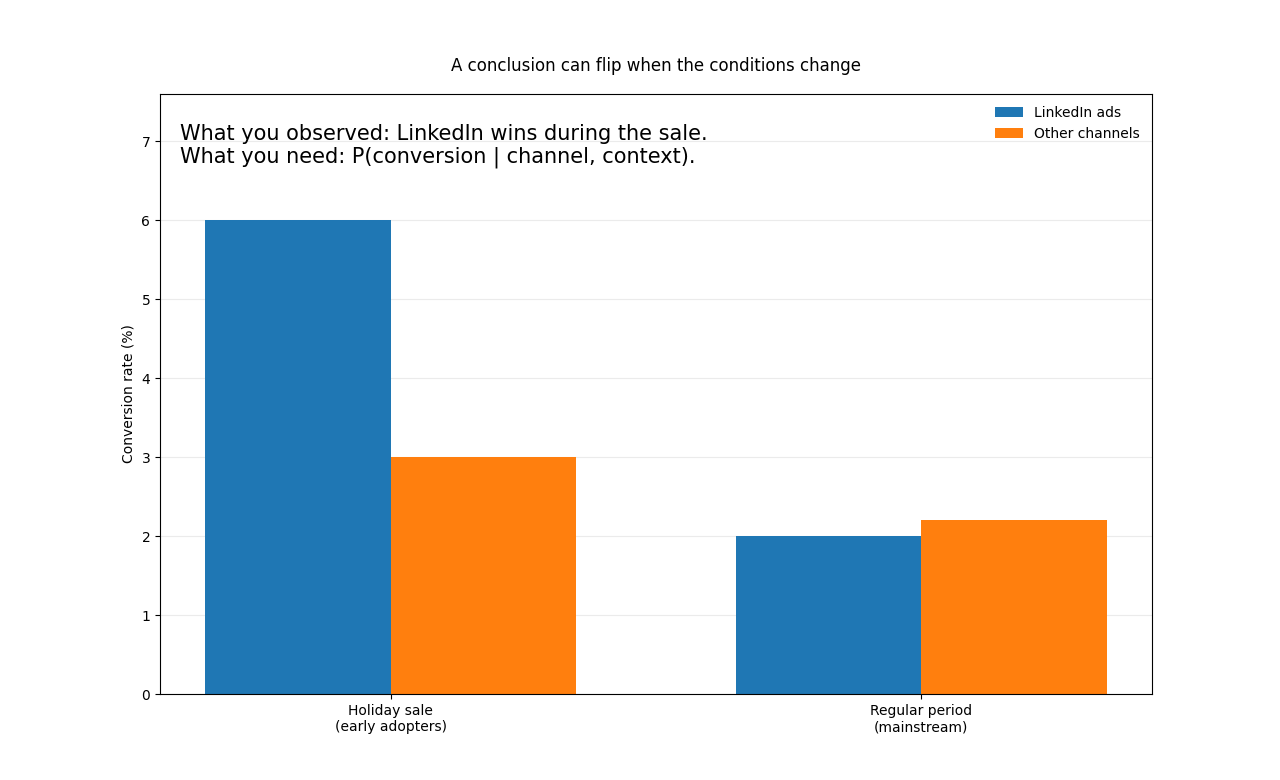
A startup sees "LinkedIn works" because conversions surged—during a holiday sale, with early adopters, and a particular product mix. They double spend later under different conditions… and the effect evaporates.
The insight
Almost every real question is: "Given X, how likely is Y?" Change X (season, segment, offer, product, market), and the answer changes. Always ask: conditional on what?
3. Base rates change everything
How you get fooled
You fixate on test accuracy and ignore how rare the condition is.
The trap in action
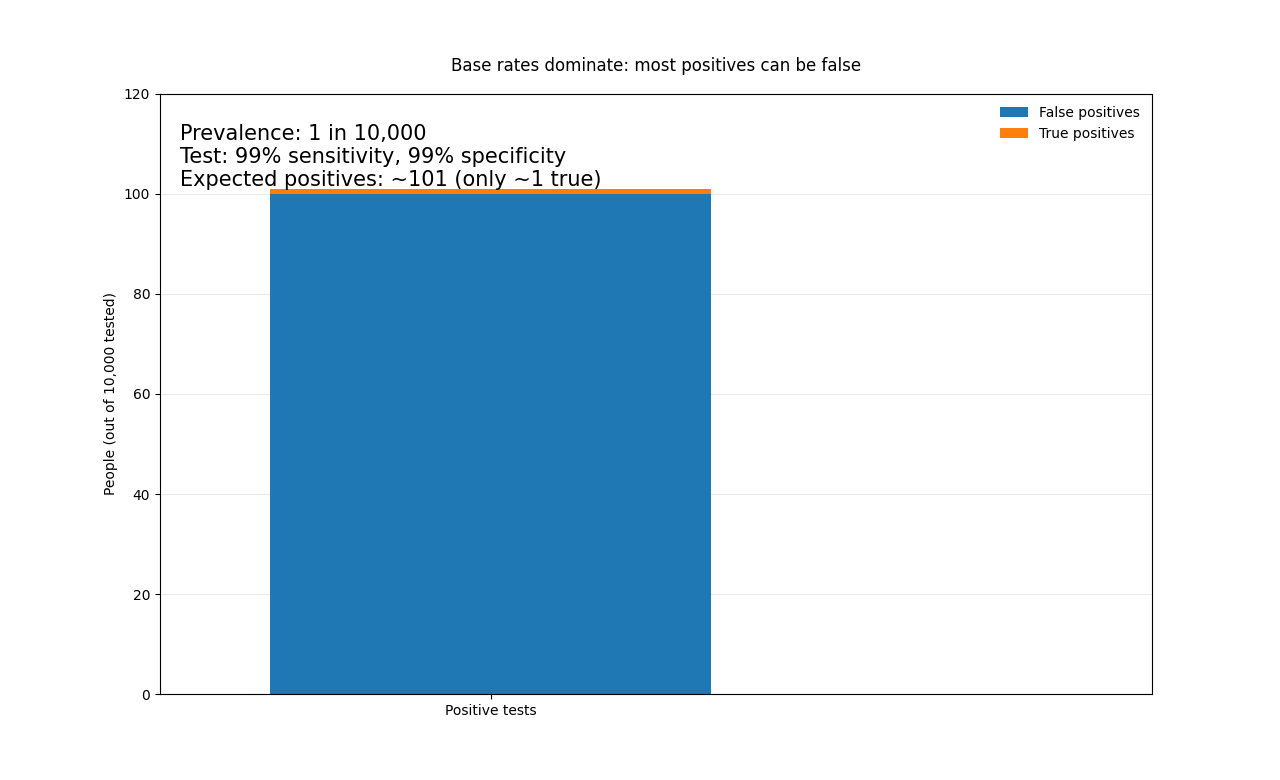
A disease affects 1 in 10,000. A "99% accurate" test comes back positive. That sounds definitive—until you count. In 10,000 people you expect ~1 true case, but ~100 false positives (if specificity is 99%). Your "positive" is usually noise.
The insight
Accuracy without prevalence is meaningless. Base rates are the gravitational field of inference. If you don't include them, your conclusions float away from reality.
4. Decisions require trade-offs
How you get fooled
You optimize one metric and pretend nothing else moved.
The trap in action
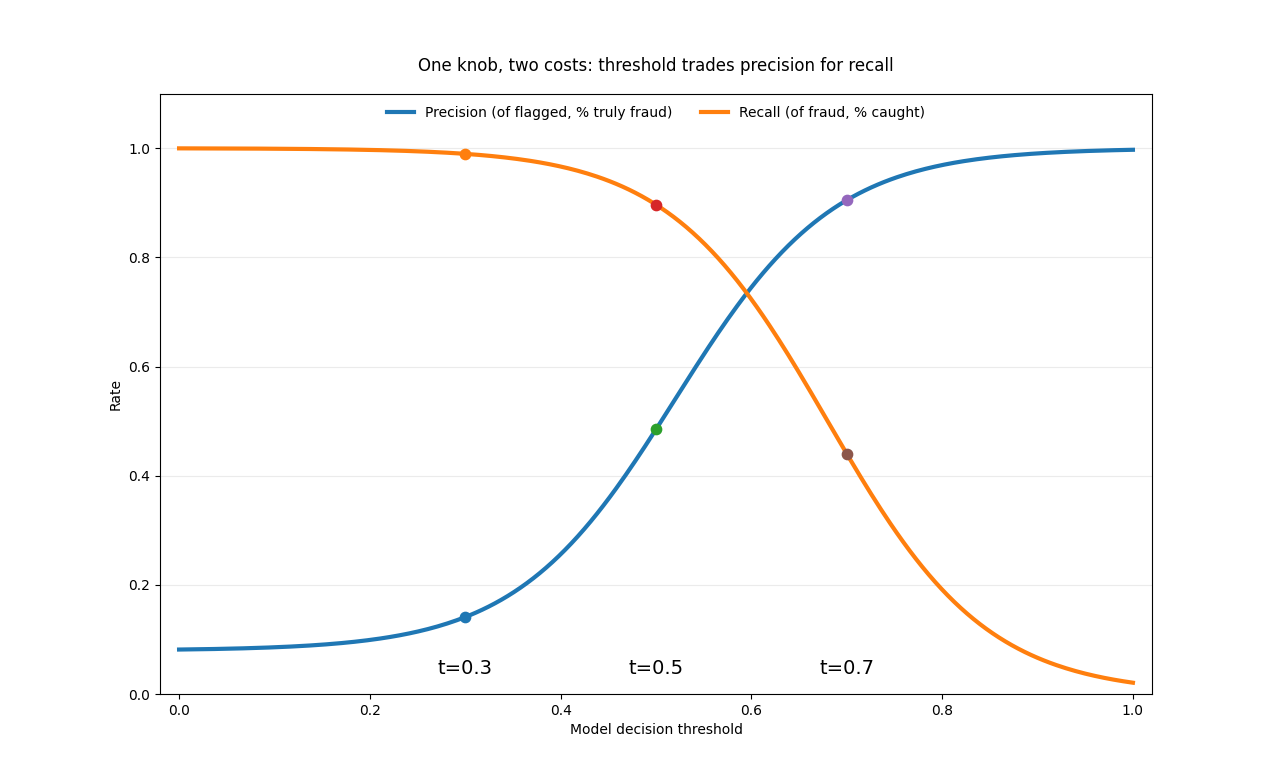
A fraud model is "99% accurate." Great—until you learn it misses most fraud (low recall), or it catches all fraud by blocking tons of legitimate customers (high false positives). The "best" model on paper can be disastrous in production.
The insight
Every threshold is a trade-off between false positives and false negatives. Probability connects model scores to expected cost—and the right threshold depends on your costs, not a braggy accuracy number.
5. Probability underpins measurement
How you get fooled
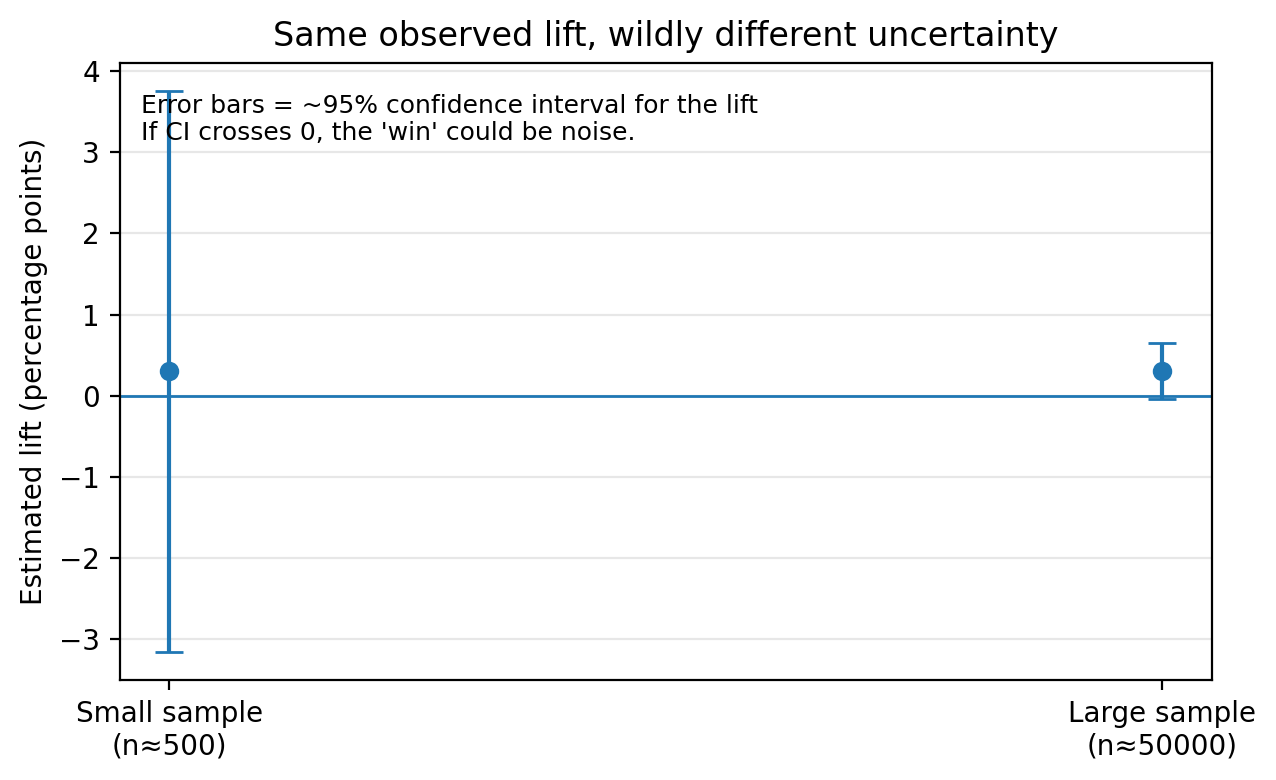
You see a difference and assume it's real.
The trap in action
Your A/B test shows 4.2% vs 3.9%. You ship after two days on a small sample. But with low traffic, that "lift" can easily be random variation—and the true effect could be zero or negative.
The insight
"Is this change real?" is a probability question. Without confidence intervals (or an equivalent uncertainty check), you're not measuring—you're guessing with spreadsheets.
6. Averages lie—distribution shape matters
How you get fooled
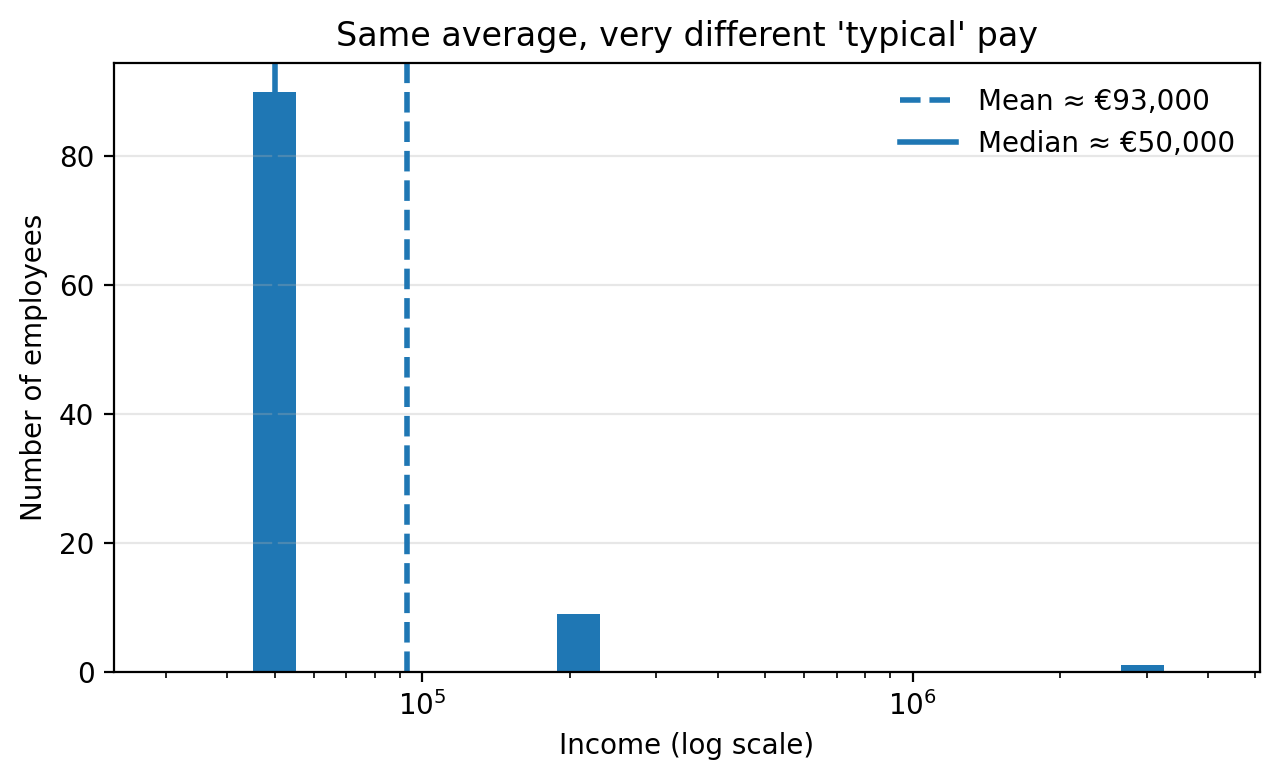
You hear an average and assume it describes a typical person.
The trap in action
"Average salary is €120k." You picture €120k… but the distribution is: many at €50k, a few at €200k, one at €3M. The mean is technically true and practically misleading.
The insight
The mean answers "total/people." The median answers "typical." When outcomes are skewed (income, response time, deal size, downtime), ask for the distribution, not a single number.
7. Simpson's paradox—aggregation hides reversals
How you get fooled
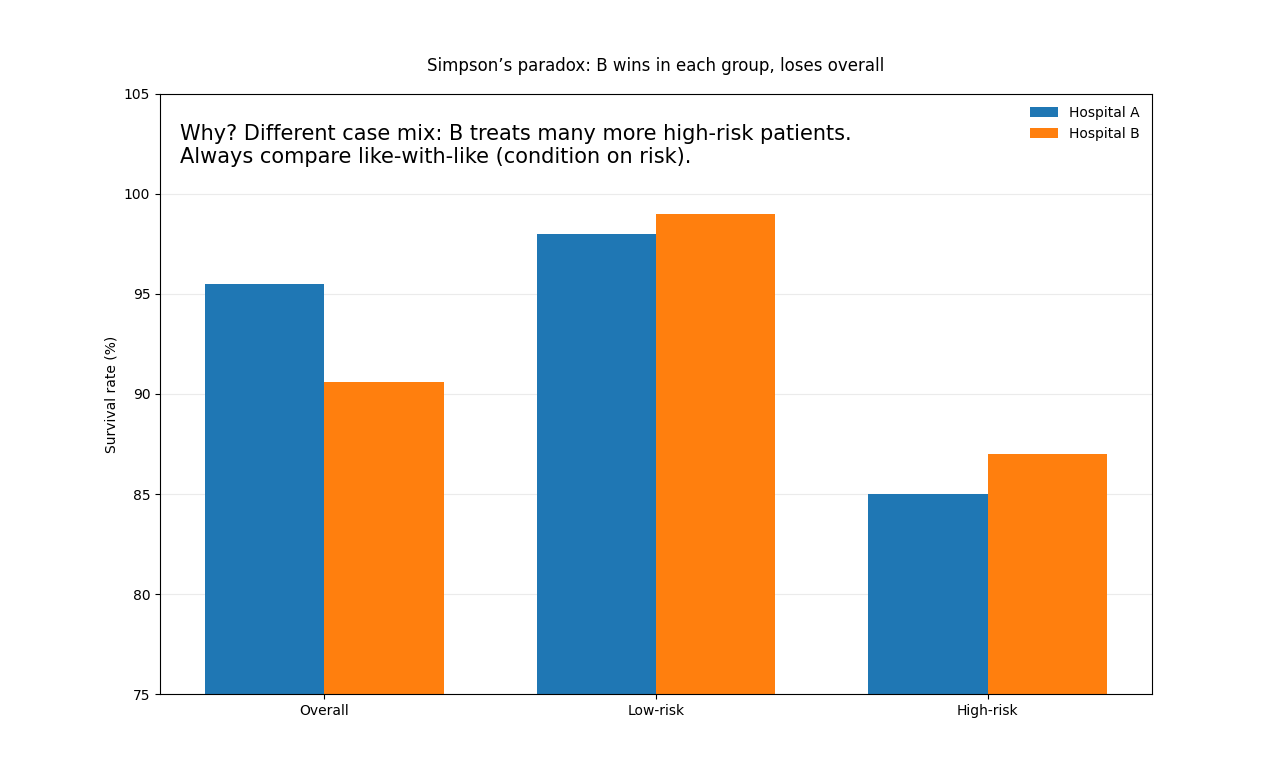
You compare totals and conclude one option is better.
The trap in action
Hospital A has higher overall survival than Hospital B. But B treats more high-risk cases. Within both low-risk and high-risk groups, B actually performs better—yet loses in the aggregate because the mix differs.
The insight
Always ask what's hiding in subgroups. Totals can tell the opposite story when group sizes differ. Condition on the variable that changes the mix.
8. Correlation is not causation
How you get fooled
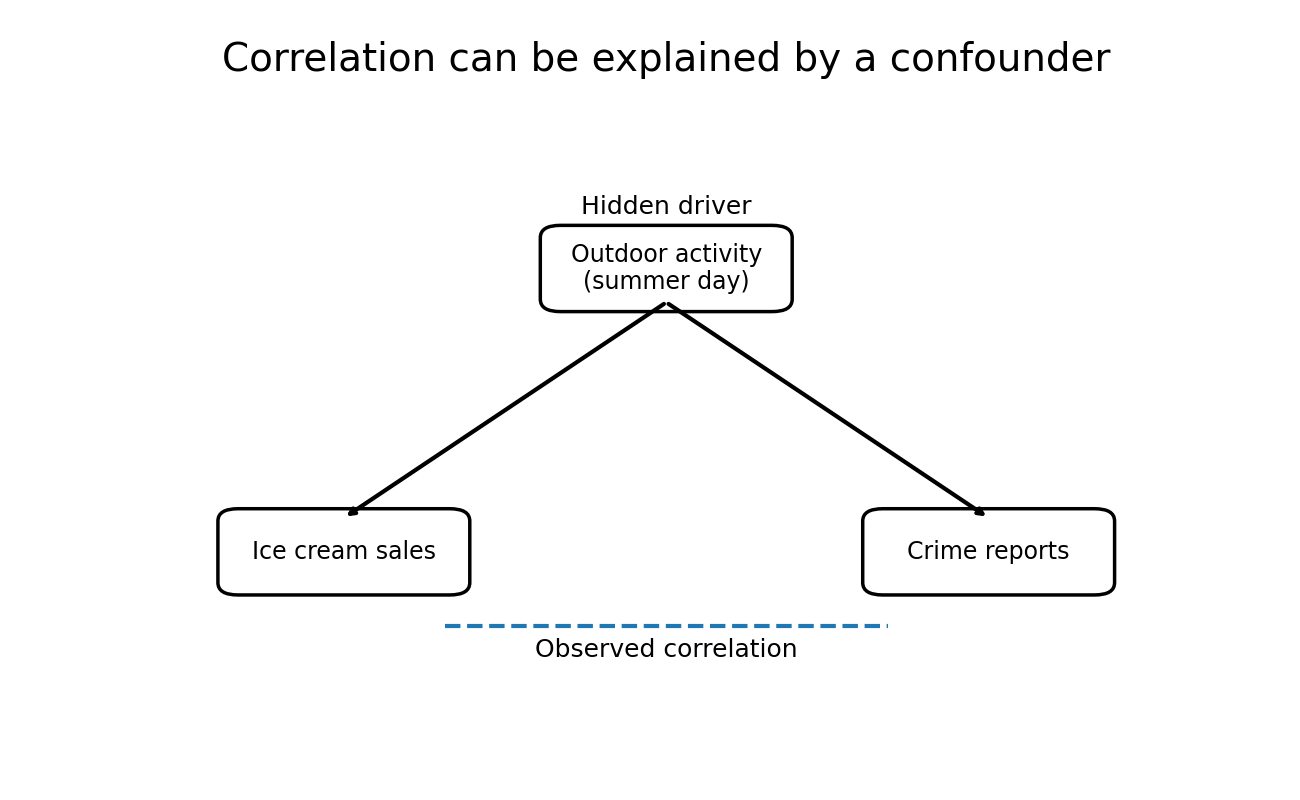
Two things move together, so you assume one causes the other.
The trap in action
Ice cream sales and crime reports can rise together. On hot/summer days, more people are out in public (and buying ice cream), which can also increase opportunities for incidents and reporting. Concluding "ice cream causes crime" is nonsense—but the same confusion shows up in serious settings when a third factor drives both.
The insight
Correlation is a clue, not a conclusion. Always ask: What third factor could cause both? For a fun gallery of nonsense correlations, see Spurious Correlations. If you can't rule out confounders, you don't have causality.
9. Survivorship bias—the silent missing data
How you get fooled
You study winners and assume their traits caused success.
The trap in action
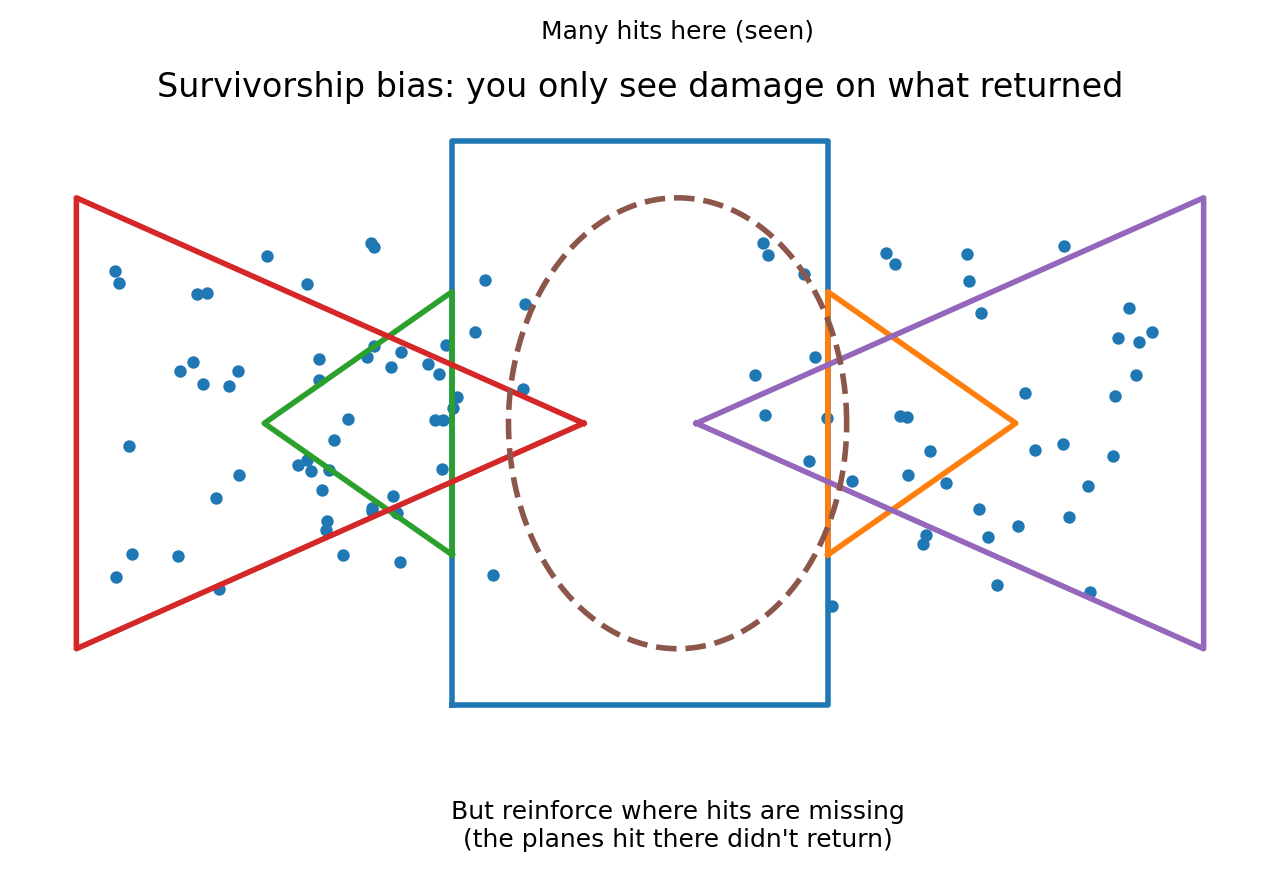
You see famous dropouts and infer "dropout → success," ignoring the huge pile of unseen dropouts who failed. In WWII, engineers wanted to reinforce bullet holes on planes that returned—until the key insight: those planes survived being hit there. The fatal hits are missing from your data.
The insight
Filters create illusions. If you only observe what made it through, your dataset is biased by survival. The missing cases are not "noise"—they're the point.
10. Variance matters as much as the mean
How you get fooled
You focus on systematic error and ignore inconsistency.
The trap in action
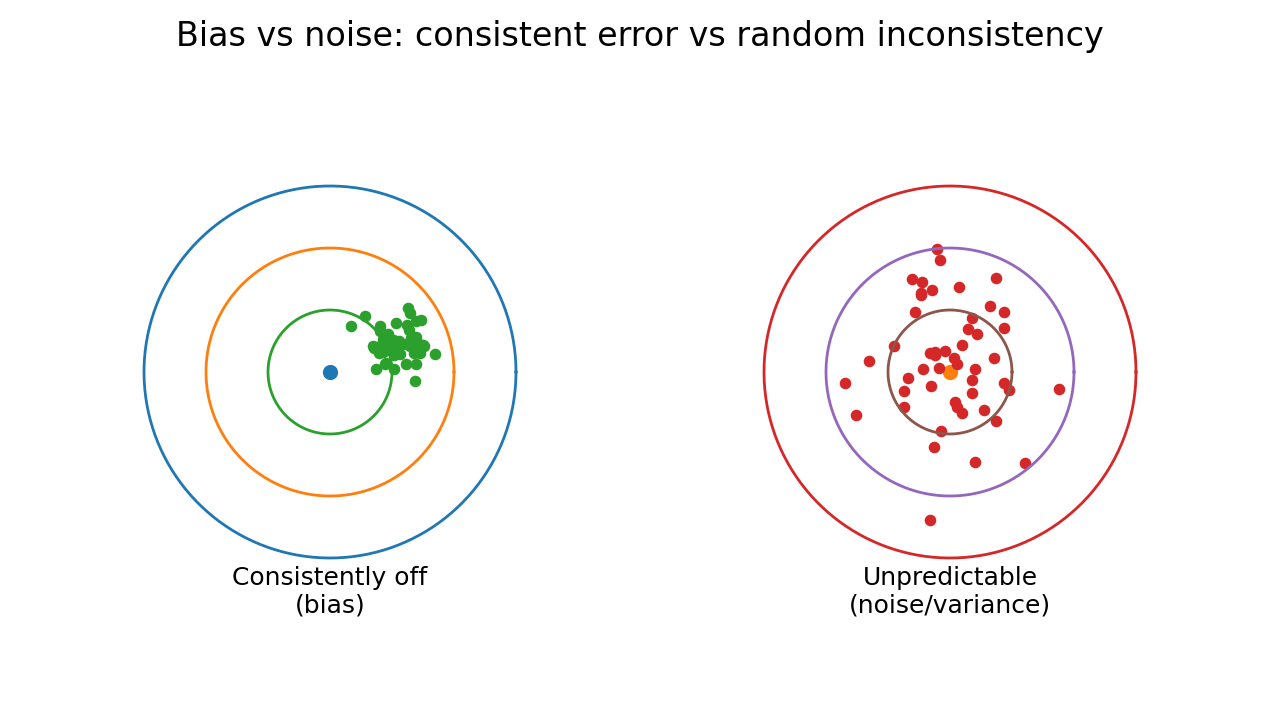
A decision-maker who is predictably harsh is easy to detect. A decision-maker who is erratic—good mood, bad mood, random day-to-day—creates equally large unfairness, but it's harder to see because it doesn't have a stable pattern.
The insight
Total error isn't just bias. It's bias and variance (noise). If you want fairness and accuracy, you must reduce random inconsistency—not only "average" mistakes.
11. Beware the cherry-picked statistic
How you get fooled
You hear a striking result and assume it was the plan all along.
The trap in action
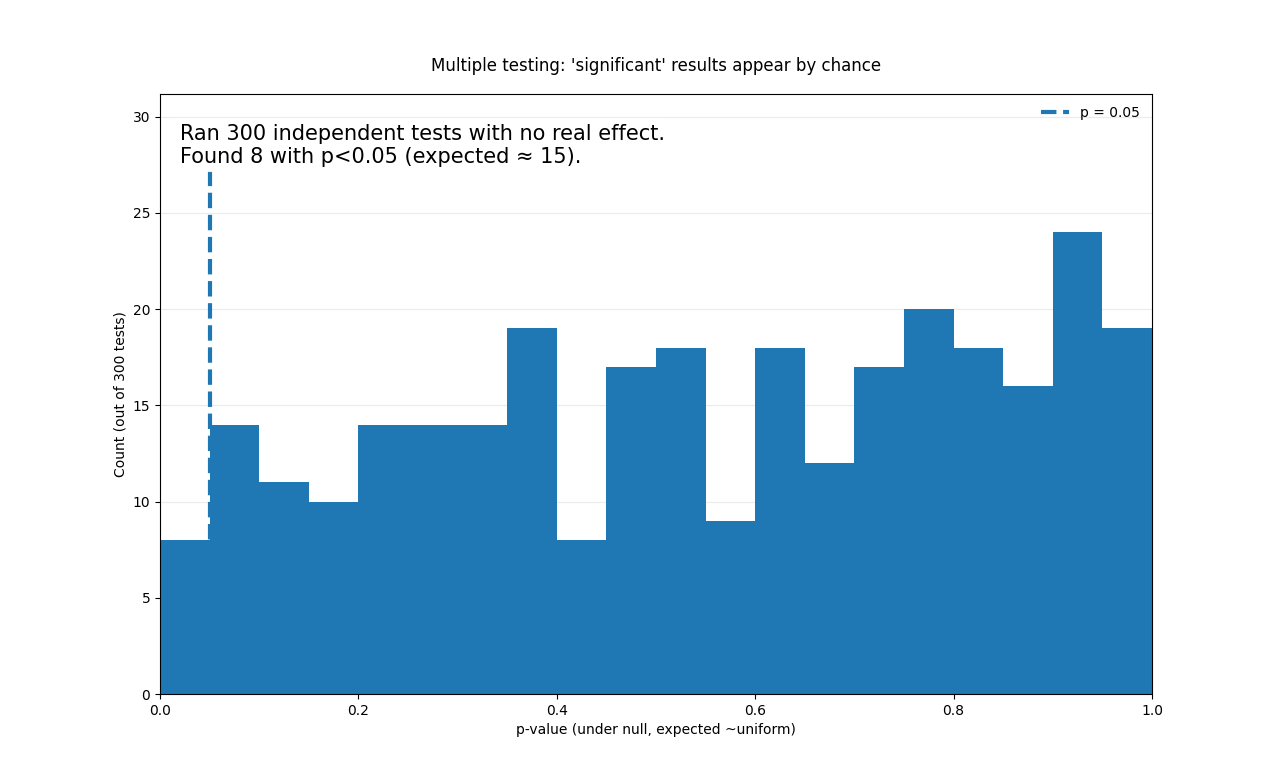
A study tries 300 foods and reports the few with p<0.05. That's not discovery; it's roulette. With enough spins, you will hit "significant" outcomes by chance—and headlines will treat them like truths.
The insight
Ask: Was this hypothesis pre-registered (picked before looking), or selected after the fact? Multiple testing guarantees some impressive-looking lies.
12. Visualizations can manipulate
How you get fooled
You trust visual proportions more than the numbers.
The trap in action
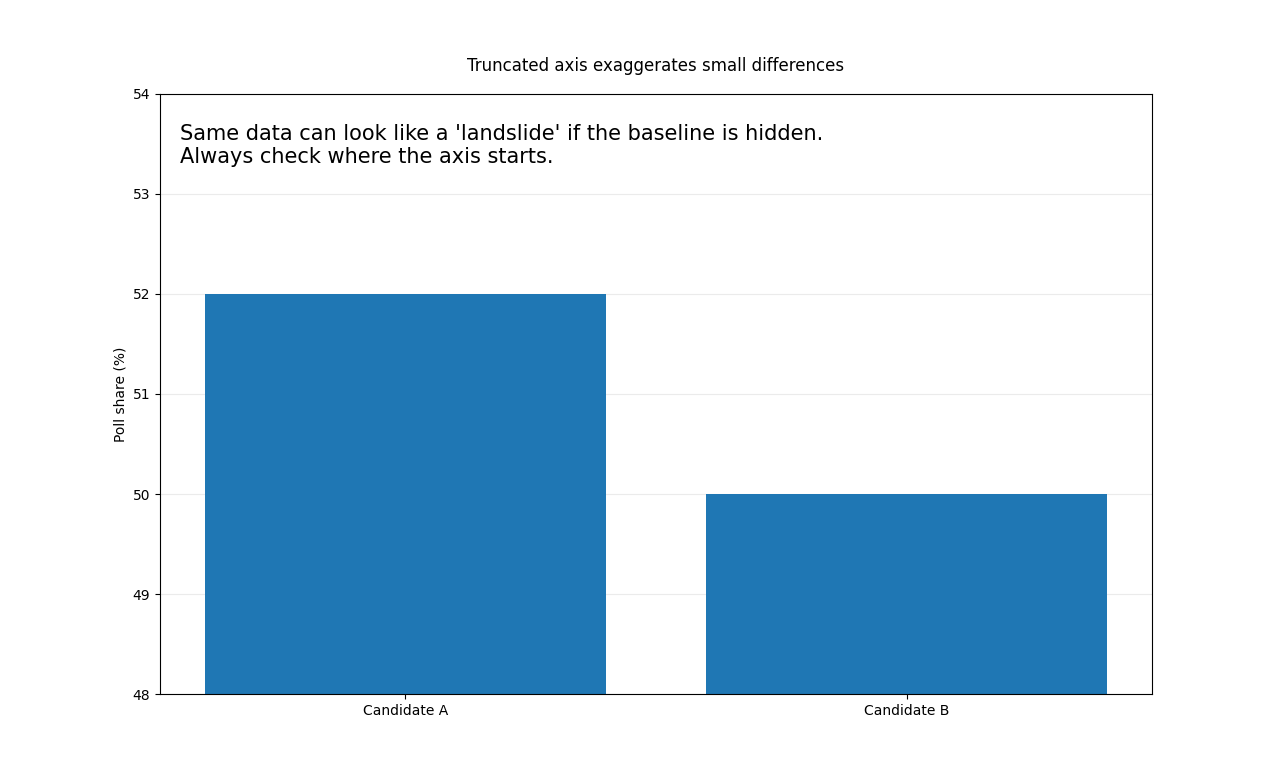
A chart makes 52% vs 50% look enormous by starting the y-axis at 48% instead of 0. Your brain reads height as magnitude—and you walk away with a strong opinion built on a design trick.
The insight
Always check axes, baselines, and scales. A chart can be technically "correct" and still engineered to mislead.