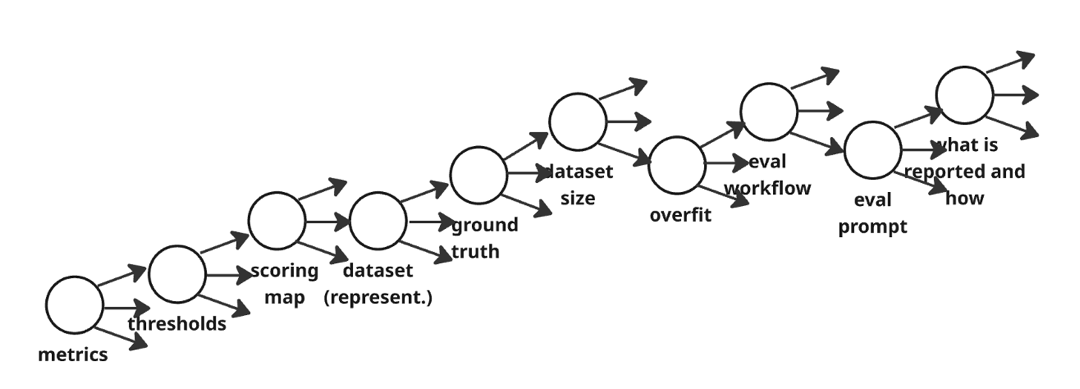
In Software 3.0, improvement is usually not a single leap, but a search process. You try a prompt tweak. You change the retrieval strategy. You reorder steps in the pipeline. You swap the judge prompt. You run the same evaluation suite again. Repeat.
This is a healthy engineering loop. But it changes what an evaluation score means. The moment we run many variants and report (or remember) the best-looking number, we have quietly introduced a statistical phenomenon that is both simple and surprisingly strong: multiple hypothesis testing.
Here, a "hypothesis" is not a formal paper claim. It is any variant we tried: a prompt version, a pipeline branch, a scoring rule, a filtering threshold, or even a different way to aggregate sub-metrics. Testing many hypotheses is not the problem. The problem is that selection ("pick the winner") converts random noise into systematic optimism.
The Dice Analogy
If you roll one fair die, the expected value is 3.5. If you roll 20 fair dice and keep the highest, the expected value is much higher—even though nothing about the dice improved. In evaluation, the "dice" are the random components of measurement: finite sample size, ambiguous ground truth, judge variability, and the many small implementation choices that leak into scores. The best score among many tries is expected to be "lucky".
The Best-of-K Effect
Let the observed score for variant i be a noisy estimate of its underlying performance:
observed_score_i = true_score_i + noise_i
Assume the noise terms are centered (the evaluation is not systematically biased for any single run), with standard deviation σ. If we run K variants and select the highest observed score:
selected_score = true_score + max(noise_1, ..., noise_K)
Even though each noise_i has mean 0, the maximum does not. The expected max is positive, so the selected score is systematically optimistic. This is the "winner's bonus".
Expected "winner's bonus" from selecting the best of K tries:
| K variants tried |
E[max noise]/σ |
If σ = 4 points, expected bonus |
| 1 |
0.000 |
+0.0 points |
| 2 |
0.564 |
+2.3 points |
| 5 |
1.163 |
+4.7 points |
| 10 |
1.539 |
+6.2 points |
| 20 |
1.867 |
+7.5 points |
| 50 |
2.249 |
+9.0 points |
By the time you have tried 10-20 variants, the expected winner's bonus is already around 1.5-1.9σ. That is not a rounding error if σ is several points.
From Test-Set Size to Best-of-K Inflation
To translate σ into something tangible, it helps to connect it to test-set size. For illustration, suppose the underlying accuracy is about 80%. The standard deviation of the measured accuracy from N cases is approximately sqrt(p(1-p)/N).
| N test cases |
σ (points) |
Best-of-5 (+ points) |
Best-of-10 (+ points) |
Best-of-20 (+ points) |
| 50 |
5.66 |
+6.6 |
+8.7 |
+10.6 |
| 100 |
4.00 |
+4.7 |
+6.2 |
+7.5 |
| 200 |
2.83 |
+3.3 |
+4.4 |
+5.3 |
| 500 |
1.79 |
+2.1 |
+2.8 |
+3.3 |
| 1000 |
1.26 |
+1.5 |
+1.9 |
+2.4 |
With N = 100 cases, the sampling-only σ is about 4 points, so best-of-20 inflation is about +7.5 points on average. And this is only sampling noise. In Software 3.0, the effective σ is often larger because the evaluation pipeline itself is stochastic or under-specified.
Why This Creates the Illusion of Progress
If none of the variants are truly better, how often will the best one still look meaningfully better?
Probability that best-of-K looks at least δ points better than truth (σ = 4 points):
| Threshold δ (points) |
Best-of-5 |
Best-of-10 |
Best-of-20 |
| 2 |
84.2% |
97.5% |
99.9% |
| 4 |
57.8% |
82.2% |
96.8% |
| 6 |
29.2% |
49.9% |
74.9% |
| 8 |
10.9% |
20.6% |
36.9% |
This explains a common experience in prompt engineering: you can "find" a 4-8 point improvement surprisingly easily when the test set is small and you iterate a lot—even if the underlying system has not improved.
The best-of-K inflation is real, but it compounds with two more fundamental problems:
Small sample sizes: If you're evaluating K variants on 100 examples, your confidence interval is already ~16 points wide before accounting for selection effects. Best-of-K adds optimism on top of already massive uncertainty.
Non-representative test data: Your test set is almost never IID with production. It's curated examples someone thought were representative, synthetic data that's "close enough," or historical data from a shifted distribution. This isn't noise—it's bias. Your evaluation could be perfectly precise and still systematically wrong because you're measuring on the wrong distribution.
If your 100-example test set doesn't reflect production, no statistical correction will save you.
A technical note: the standard best-of-K analysis assumes independent noise across variants. In practice, when variants share the same test set and judge, noise is partially correlated—which reduces but does not eliminate the inflation. The core insight holds: selection on noisy estimates produces optimistic results.
Three Context Questions
When you see a crisp green number, three context questions often unlock most of the uncertainty:
- How many variants were tried and compared on this same dataset?
- How noisy is one evaluation run (what is σ)?
- How wide was the search (were variants meaningfully different, or minor edits)?
Sadly, this is not a theoretical paranoia. It's real. You need to manage it.